Contents
- Acknowledgements
- Practice Analysis Task Force
- Introduction
- Results Related to Professional Background, Work Setting and Demographic Information
- Results Related to Domains, Tasks and Knowledge and Skill Statements
- Domain Ratings
- Task Ratings
- Knowledge and Skills Ratings
- Results Related to Practice Areas and Devices
- Highlights
©2025 by the American Board for Certification in Orthotics, Prosthetics & Pedorthics, Inc. All rights reserved.
No part of this document may be produced in any form without written permission of the American Board for Certification in Orthotics, Prosthetics & Pedorthics, Inc.
Practice Analysis of Certified Technicians in the Disciplines of Orthotics and Prosthetics
January 2017
Results Related to Practice Areas and Devices
All survey respondents were asked to characterize the nature of their work in regard to an extensive list of orthotic or prosthetic devices, as appropriate. Dually certified respondents were asked to complete the task for the one discipline in which they spend the most time.
The results of these rating activities should be reviewed very carefully, as they provide guidance with regard to the development and/or refinement of ABC’s certification exams. The results also provide guidance to the National Commission on Orthotic and Prosthetic Education (NCOPE) in the development of orthotic and prosthetic education standards.
Orthotic Practice Areas and Devices
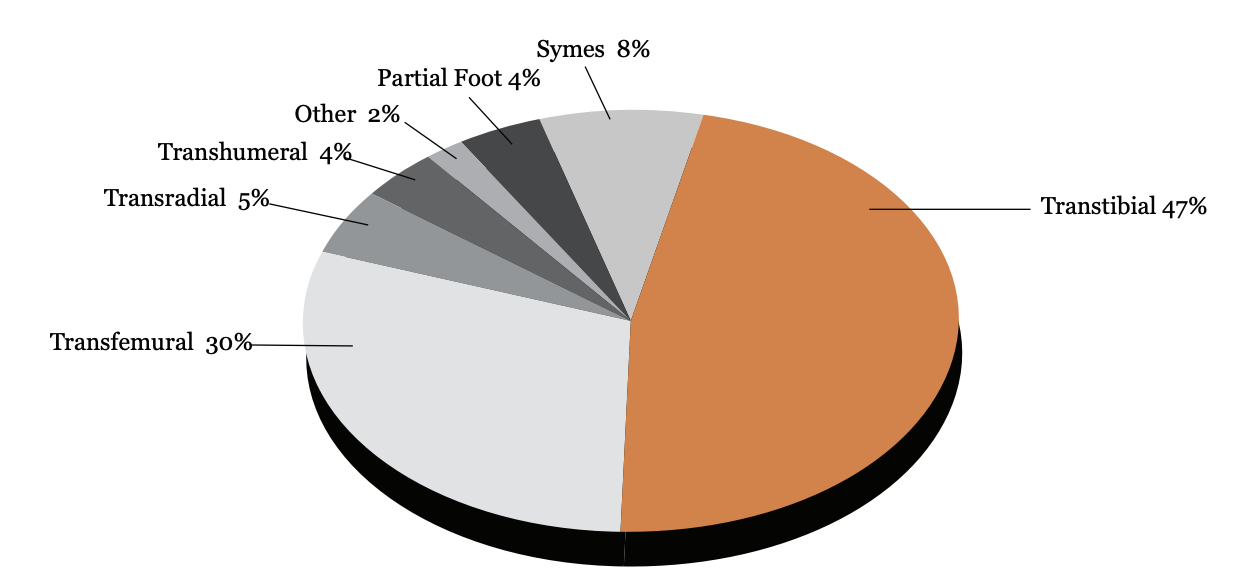
As shown in Figure 2, those respondents who participated in the prosthetic version of the survey spent almost half their time (47%), on average, in transtibial practice, followed by transfemoral (30%) and Symes (8%).
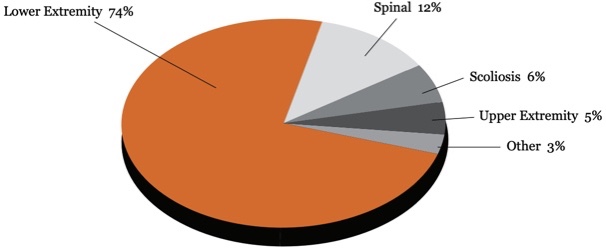
Figure 1
Percentage of Time in Orthotic Practice Areas

Table 18 provides details about the percentage of time spent with regard to specific orthotic devices. Within lower extremity, AFOs totaled 36% of time and KAFOs totaled 14.6% of time.
Table 18
| Lower Extremity | 74.2% |
|---|---|
| Shoe modifications | 6.1% |
| FO | 7.3% |
| SMO (supra malleolar orthosis) | 4.2% |
| AFO (leather gauntlet) | 3.3% |
| AFO (metal) | 4.7% |
| AFO (plastic) | 26.2% |
| AFO (composite) | 1.8% |
| KO | 2.4% |
| KAFO (metal) | 3.9% |
| KAFO (plastic) | 8.4% |
| KAFO (composite) | 1.0% |
| KAFO (stance control) | 1.3% |
| HO | 0.6% |
| HKAFO | 1.9% |
| Other | 1.1% |
| Spinal | 11.8% |
| LSO (metal) | 0.2% |
| LSO (thermoplastic) | 3.1% |
| TLSO (metal) | 0.6% |
| TLSO (thermoplastic) | 5.9% |
| CTO | 0.6% |
| CO | 0.5% |
| Other | 0.9% |
| Scoliosis | 5.9% |
| TLSO | 4.9% |
| CTLSO (Milwaukee) | 0.5% |
| Other – “All go to central fabrication” | 0.5% |
| Upper Extremity | 5.3% |
| HO | 0.3% |
| WHO | 2.7% |
| EWHO | 0.8% |
| EO | 1.1% |
| Other | 0.4% |
| Other | 2.8% |
| Dynamic contracture orthosis | 1.6% |
| Protective face mask | 0.4% |
| Cranial molding orthosis | 0.8% |
Respondents indicated if they performed a number of activities with respect to specific orthotic devices at any time during the past year; results are shown in Table 19.
Table 19
| Perform Initial Patient Evaluation | Measure/ mold/ trace/ digitize/ scan | Modify model/ image/ tracing | Fabricate | Fit Patient | Re-evaluate patient | Modify/ repair/ replace | |
|---|---|---|---|---|---|---|---|
| Lower Extremity | |||||||
| Shoe modifications | 12% | 12% | 31% | 71% | 17% | 10% | 10% |
| FO | 12% | 24% | 49% | 81% | 15% | 8% | 54% |
| SMO (supra malleolar orthosis) | 8% | 12% | 46% | 73% | 12% | 7% | 49% |
| AFO (leather gauntlet) | 8% | 8% | 29% | 42% | 10% | 7% | 39% |
| AFO (metal) | 7% | 10% | 46% | 75% | 5% | 3% | 46% |
| AFO (plastic) | 8% | 22% | 58% | 88% | 14% | 7% | 59% |
| AFO (composite) | 7% | 8% | 20% | 41% | 7% | 5% | 34% |
| KO | 10% | 15% | 32% | 54% | 12% | 8% | 41% |
| KAFO (metal) | 5% | 12% | 37% | 66% | 7% | 5% | 46% |
| KAFO (plastic) | 8% | 19% | 49% | 81% | 10% | 7% | 61% |
| KAFO (composite) | 5% | 5% | 19% | 37% | 5% | 3% | 29% |
| KAFO (Stance control) | 3% | 5% | 20% | 37% | 3% | 2% | 31% |
| HO | 7% | 7% | 24% | 34% | 7% | 7% | 31% |
| HKAFO | 5% | 10% | 29% | 51% | 7% | 5% | 37% |
| Spinal | |||||||
| LSO (metal) | 3% | 3% | 12% | 17% | 3% | 3% | 15% |
| LSO (thermoplastic) | 10% | 10% | 32% | 53% | 12% | 8% | 42% |
| TLSO (metal) | 5% | 5% | 17% | 22% | 5% | 3% | 19% |
| TLSO (thermoplastic) | 10% | 15% | 36% | 59% | 10% | 7% | 47% |
| CTO | 8% | 10% | 14% | 19% | 10% | 7% | 27% |
| CO | 7% | 5% | 10% | 17% | 7% | 5% | 19% |
| Scoliosis | |||||||
| TLSO | 8% | 15% | 22% | 44% | 10% | 7% | 42% |
| CTLSO (Milwaukee) | 5% | 7% | 7% | 17% | 8% | 5% | 17% |
| Upper Extremity | |||||||
| HO | 5% | 8% | 27% | 37% | 8% | 5% | 31% |
| WHO | 7% | 14% | 36% | 59% | 8% | 5% | 42% |
| EWHO | 5% | 10% | 27% | 46% | 8% | 3% | 36% |
| EO | 7% | 10% | 29% | 46% | 8% | 5% | 36% |
| Other | |||||||
| Dynamic contracture orthosis | 7% | 5% | 8% | 20% | 7% | 3% | 19% |
| Protective face mask | 0% | 3% | 12% | 27% | 0% | 0% | 20% |
| Cranial molding orthosis | 2% | 5% | 5% | 10% | 2% | 2% | 10% |
Prosthetic Practice Areas and Devices
As shown in Figure 2, those respondents who participated in the prosthetic version of the survey spent almost half their time (47%), on average, in transtibial practice, followed by transfemoral (30%) and Symes (8%).
Figure 2
Percentage of Time in Prosthetic Practice Areas

As seen in Table 20, within the transtibial area endoskeletal and laminated devices were most common, while in the transfemoral area, endoskeletal and combination devices (flexible inner socket, rigid frame) were most common.
Table 20
| Partial foot | 3.8% |
|---|---|
| Silicone | 0.8% |
| Leather | 0.3% |
| Composite | 1.6% |
| Thermoplastic | 1.1% |
| Symes | 7.6% |
| Expandable wall | 0.5% |
| Removable window | 2.7% |
| Removable insert or liner | 4.4% |
| Transtibial | 47% |
| Exoskeletal | 4.6% |
| Endoskeletal | 18.9% |
| Thermoplastic | 2.8% |
| Laminated | 11.6% |
| Combination (flexible inner socket, rigid frame) | 9.1% |
| Transfemoral | 30.5% |
| Exoskeletal | 2.1% |
| Endoskeletal | 12.5% |
| Thermoplastic | 1.3% |
| Laminated | 4.2% |
| Combination (flexible inner socket, rigid frame) | 9.0% |
| Knee disarticulation | 0.7% |
| Hip disarticulation | 0.7% |
| Transradial | 5.3% |
| Myoelectric | 1.7% |
| Body-powered | 3.6% |
| Transhumeral | 4.1% |
| Myoelectric | 0.6% |
| Body-powered | 2.3% |
| Hybrid (body-powered elbow, myoelectric hand) | 0.5% |
| Shoulder disarticulation | 0.7% |
| Other (e.g. PFFD, Rotationplasty) | 1.7% |
Respondents indicated if they performed a number of activities with respect to specific prosthetic devices at any time during the past year; results are shown in Table 21.
Table 21
| Perform Initial Patient Evaluation | Measure/ mold/ trace/ digitize/ scan | Modify model/ image/ tracing | Fabricate | Fit Patient | Reevaluate patient | Modify/ repair/ replace | |
|---|---|---|---|---|---|---|---|
| Symes | 7% | 13% | 25% | 86% | 13% | 10% | 65% |
| Transtibial | 13% | 23% | 47% | 98% | 22% | 21% | 78% |
| Van Ness rotationplasty | 3% | 4% | 11% | 32% | 4% | 4% | 25% |
| Knee disarticulation | 5% | 13% | 13% | 84% | 10% | 13% | 59% |
| Transfemoral | 13% | 21% | 38% | 98% | 22% | 19% | 75% |
| Hip disarticulation or hemipelvectomy | 7% | 8% | 16% | 60% | 9% | 10% | 47% |
| Partial hand | 3% | 3% | 10% | 35% | 4% | 7% | 30% |
| Wrist disarticulation | 4% | 7% | 14% | 48% | 5% | 7% | 38% |
| Transradial | 7% | 12% | 25% | 76% | 11% | 13% | 59% |
| Transhumeral or elbow disarticulation | 3% | 7% | 18% | 63% | 8% | 11% | 47% |
| Shoulder disarticulation | 3% | 3% | 9% | 31% | 5% | 7% | 26% |
| Congenital limb deficiency | 7% | 9% | 19% | 56% | 10% | 10% | 42% |


